Saturday, April 15, 2017

3-April-2017: Centripetal Force with a Motor

Lab#9: Centripetal Force with a Motor
May Soe Moe
Lab Partners: Ben Chen, Steven Castro
3-April-2017

Objective: To come up with a model that describes the relationship between the angular speed ω and the angle θ that was created with the string attaching the rubber stopper while revolving around the y-axis--the surveying tripod. 

Introduction: After getting the apparatus set up first, we tried spinning the rubber stopper attached to a string with motor. We found that the rubber stopper revolved around the y-axis--the central pole or surveying tripod got larger radius and larger angle θ as the motor spin at a higher angular speed ω. We wanted to know the relationship between the angular speed ω and the angle θ. We would draw up free body diagrams of all forces acting on the rubber stopper during revolution and derive the angular speed ω in terms of angle θ. From our setup, we did not know the angle that was forming during the revolution and the way we came up with to measure the angle was by setting a ring stand with honrizontal piece of paper sticking out. Then we adjusted the ring stand's height so that the rubber stopper will hit the horizontal paper. When we got that height, then we could mathematically calculate the angle with all our other measurements and datas. From our setup, we could calculate the missing values such as the angle θ, the radius created by the string with rubber stopper, the total radius (the original radius of the apparatus and the radius created by the string with rubber stopper) using trigonometry. We would calculate our derived angular speed ω equation using the calculated missing values (θ, total radius). We could then compare the values we got from our derived equation and the angular speed formula which we knew-- ω= 2π/T. 

Experimental Procedure:

(1) The apparatus set up was done by the professor as in the picture below:
Apparatus


Diagram we used for calculating θ, Lsinθ, and Total Radius
(2) The apparatus was set up by putting an electric motor on a surveying tripod, a vertical rod on the motor, a horizontal rod perpendicularly mounted on a vertical rod, a long string tied to the end of the horizontal rod, a rubber stopper at the end of the string, and a ring stand with a horizontal piece of paper sticking out.

(3) We ran the electric motor and let the rubber stopper revolve around the surveying tripod at unknown angular speed ω and angle θ.

(4) We ran the motor at certain angular speed ω and timed the time to complete ten revolutions. And we divided that time by 10 to get the time for one revolution.

(5) We adjusted the ring stand with a horizontal piece of paper sticking out while the rubber stopper was spinning around the tripod to a height when the spinning rubber stopper hit the horizontal paper.

(6) We stopped running the electric motor when the rubber stopper hit the horizontal paper taped to the ring stand. We measured the height of the ring stand from the ground to the horizontal paper.

(7) We also got other measurements such as the Length of R, the length of L, and the length of H as described in the diagram above.

(8) We increased the voltage of the motor driving the system and repeated the same steps for five more times to get our datas.

Calculations:


Calculated Values
Here are the equations that were used to find the values above and some clarifications that might be needed for the column headers.


Here is our free diagram of forces acting on the rubber stopper and our derived equation that represents the relationship between the angle θ and the angular speed ω.


Conclusion: 


We compared the two angular speed ω values we got--values we got from our known angular speed ω equation-- ω= 2π/T, and our derived equation. It turned out that our theoretical values are larger than our experimental values. Our percentage of errors came out to be less than 5% except the last ω. Except our error percentage, our results are in the acceptable range. The last angular speed ω for both using T and using h are very high, thus leading to higher percentage error. Uncertainties or things that led us to commit some errors could be that we assumed the angular speed ω of the string with the rubber stopper was constant throughout the rotation when it could be speeding up over time. We ignored air resistance. The height of the ring stand with horizontal paper sticking out, and the L sin θ values could be smaller than what we recorded in reality, since the rubber stopper hit the horizontal paper when what we should record was the rim of the paper. We took longer time as we had to time the time to complete ten rotations and to adjust the height of the horizontal paper sticking out so that the rubber stopper would hit the paper. During that time of ten revolutions and adjusting the height of the paper, the rubber stopper could be speeding up. Regardless of all the uncertainties and errors, our experimental values came out to be acceptable.

Thursday, April 13, 2017

5-April-2017: Activity- Work and Power


Lab#10: Work and Power
May Soe Moe
Lab partners: Ben Chen, Steven Castro
5-April-2017

Objective: To calculate the work and power output produced during performance of activities such as walking up the stairs, running up the stairs, and lifting up a bag of certain mass to a height h that is connected to a rope and a pulley.

Introduction: In our daily lives, we do work and produce power, which in Physics work equals force applied and distance traveled, and power is work divided by time. We can also relate to power in our daily lives, especially as the technology improves nowadays. We use power to produce electricity, to light up our homes, to watch TV, to charge our mobile phones and laptops, and to heat up our food in microwave. We have to use power even to use internet. But we have no idea how much it takes to produce power. Therefore, we tried to do work by walking up the stairs, running up the stairs, and lifting up a bag with mass to a height, which was attached with a rope and a pulley. Using our known formulas of work and power, we would calculate the work done and power output during the activities. Using the same formulas, we could calculate how much it takes to produce power for our everyday activities as mentioned above. In this case, our work done and power output were:


Experimental Procedure:

Part 1:
(1) The professor set up the rope that goes over pulley. At the end of the rope from the ground, three backpacks with different masses (5 kg, 6 kg, and 9 kg) were tied. At the balcony, the pulley was tied to a wooden stick so that it could be used to connect to the rope and the backpack.
(2) During this procedure, we were to lift up a backpack containing a known mass (5 kg,  6 kg, and 9 kg) from the ground to the wooden stick by pulling on the rope that went over a pulley-- tied to a wooden stick at the balcony.
(3) Each individual in the group was to complete the experiment and to get timed for their own since individuals' time to complete the experiment were different depending on the ability and strength to lift the backpack. We could also choose which backpack we wanted to lift up. When pulling up the backpack, one person from the group had to press down the wooden stick that was tied to the pulley so that it would not move up and hurt the people passing by.
(4) My time to lift up the backpack was 49.93 seconds, the backpack I lifted up contained 5 kg, and the height from the ground to the balcony was 4.5 meters.

Lifting up the backpack

Walking up to the stairs

Calculation For Part 1:
The power output to lift up a 5 kg backpack for me came out to be 4.42 Watts. 


Part 2: 

(1) For this part, each individual from the group walked up the stairs and got timed to get to the top of the stairs.
(2) We measured the height of a step of a stair, which was 17 cm or 0.17 m. There were 26 stairs, therefore, the total height was 26 stairs x 0.17m, which came out to be 4.42m.
(3) My power output to reach the top of the stairs came out to be 223.1 Watts.


 Part 3: 

(1) We timed while running up to the stairs. The height of the stairs was the same from part 2. Calculation of my power output to reach the top of the stairs was 441.7 Watts.


Conclusion:

(4a) Q: In our analysis, we neglected our kinetic energy in calculating the total work that we did. Make a reasonable estimate of how big of an error this introduces into your results.

              
Calculation:
Calculating the distance L of a flight of stairs


        My calculations tell me that error of kinetic energy for lifting up the 5 kg backpack was 0.009%, error of kinetic energy for walking up the stairs was 0.6%, and the error of kinetic energy for running up the stairs was 2.4%. All the errors were under 5%, which is in acceptable range, therefore, the negligence of kinetic energy in calculating my total work that I did was not affected.

(4b) Q: A microwave oven typically has a power consumption of approximately 1100 Watts. How many of the flights of stair we used in this lab would you have to climb each second to equal the power output a microwave oven?

Calculation:


(4c) Q: Suppose you are cooking two potatoes in the microwave oven for a total of 6 minutes. How may flights of steps total would you have to climb to be equivalent to the amount of work that it took to run the microwave?

Calculation: 


(4d) A person in reasonably good shape can comfortably put out 100 Watts continuously (say, by riding a stationary bicycle connected to a generator.) A 100 % efficient water heater would require about 12.5 MJ (megajoules - 10^6 joules) of energy to heat water for a 10-minute shower (flow rate of 10 liters per minute, approximately 2.5 gallons per minuter, water being heated from 20 Degrees Celsius to 50 Degrees Celsius.)

(Q1): How much power is this?

Calculation: Power to heat water came out to be 20833 Watts.


(Q2): If you gathered a group of people to ride bicycle-powered generators in order to heat the water for your shower in real time, and each one was putting out 100 Watts, how many people would it require to heat the water for your shower?

Calculation: 208 men are needed to heat the water for my shower.


(Q3): If instead you were going to provide all of the energy yourself, how long would you have to ride on a bicycle-powered generator in order to heat water for your 10-minute shower?

Calculation: I need to ride a bicycle-powered generator for 124998 seconds if in seconds, 2083 minutes if in minutes, or 35 hours if in hours in order to heat water for my 10-minute shower.


Thursday, April 6, 2017

27-March-2017: Demonstration--Centripetal Acceleration Vs. Angular Frequency


Lab#8: Demonstration--Centripetal Acceleration Vs. Angular Frequency
May Soe Moe
Lab Partners: Ben Chen, Steven Castro
27-March-2017

Objective: To determine the relationship between centripetal acceleration and angular frequency

Introduction: To achieve our objective, we made measurements that will help calculate the values such as ω(omega) and frequency to help find the relationship, which are: (1) the time it took for the disk to make ten rotations at a range of power supply, (2) force during rotation, and (3) distance of the mass from the center of the rotating mass. Through these datas we got from measurements, we would plot Force vs mω^2, and Force vs rω^2. The slope of these graphs would be radius and mass of the object respectively.

Experimental Procedure:
This whole experiment was done by the professor and the datas we took were used by all classmates due to the limited quantity of apparatus and the time restraint.
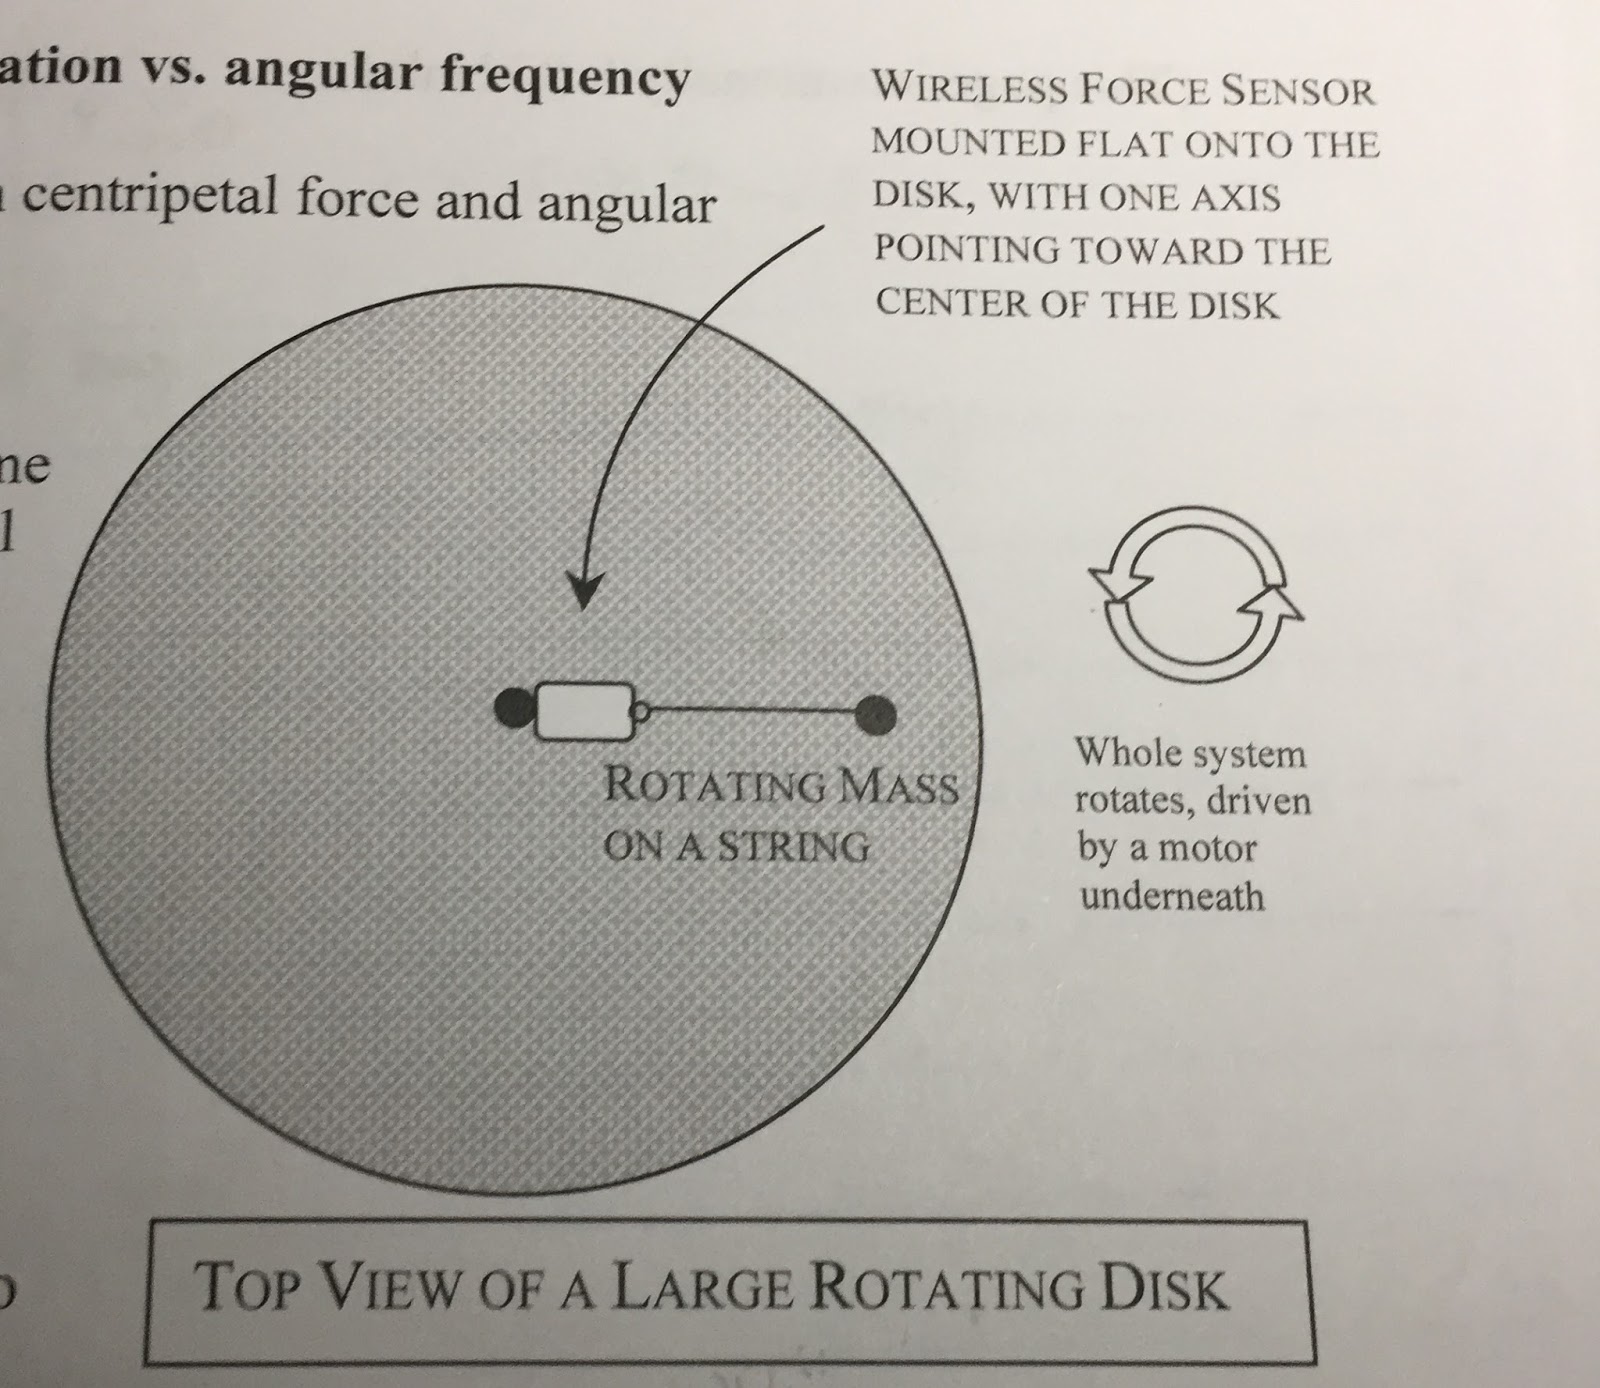
Our Apparatus of the Day: Rotating Disk


Side View of a Large Rotating Disk with set up of Photogate 
We got the apparatus set up below:

(1) Placed the wireless force sensor on the disk and let the force to be zero at the beginning of the disk rotation. Used a piece of tape on the disk rim to make sure it passes through the photogate when the disk was rotating. Photogate helped determine the rotational speed of the disk.

(2) Adjusted the voltage on the power supply, turned on the scooter motor, let the disk rotate at a constant speed, and recorded the force sensor reading.

(3) Collected period and force data at varied rotational masses (0.3kg, 0.2kg, 0.1kg, and 0.05kg) at a fixed speed, at varied radii (0.548m, 0.39m, 0.23m, and 0.47m) at fixed mass and speed, and at varied voltage from the power supply feeding the motor (3.4, 3.8, 4.2, and 3), which was various rotational speed at constant mass and constant radii.
Getting Data from Force Sensor  
Getting Data for Time at specific rotation
The peak of each section of the graph represents the time after numbers of rotation.

Data of Varied Rotational Mass, Constant Speed, Constant Radii, and Other Calculations

Data of Varied Radii, Constant Speed, Constant Mass, and Other Calculations
Data of Varied Speed, Constant Mass, Constant Radii, and Other Calculations
(4) At first, we tried to plot the datas from different scenarios in which the experiment was first done on the varied rotational mass, constant speed and constant radii; the second part of the experiment was varying radii of the string of the rotational mass, constant speed, and constant mass; and the third part was varying the rotational speed or voltage of the power supply, constant mass, and constant radii.

(5) Our formula for this lab to figure out the relationship between the centripetal acceleration and angular frequency was 
(6) Our first attempt to plot was a failure because one of the linear fit of the graph was not constant or as near to constant when we plotted the datas we got. If we had been successful in our first attempt, the graphs should look like this:

(7) Since our first attempt was a failure, our next attempt was by plotting in different way as shown in the picture below: 
                  
Force vs. mω2 Graph, Slope= radius= 0.4441

Force vs. rω2 Graph, Slope =mass= 0.2704

Comparisons of Actual Measurements and Graphically Calculations:


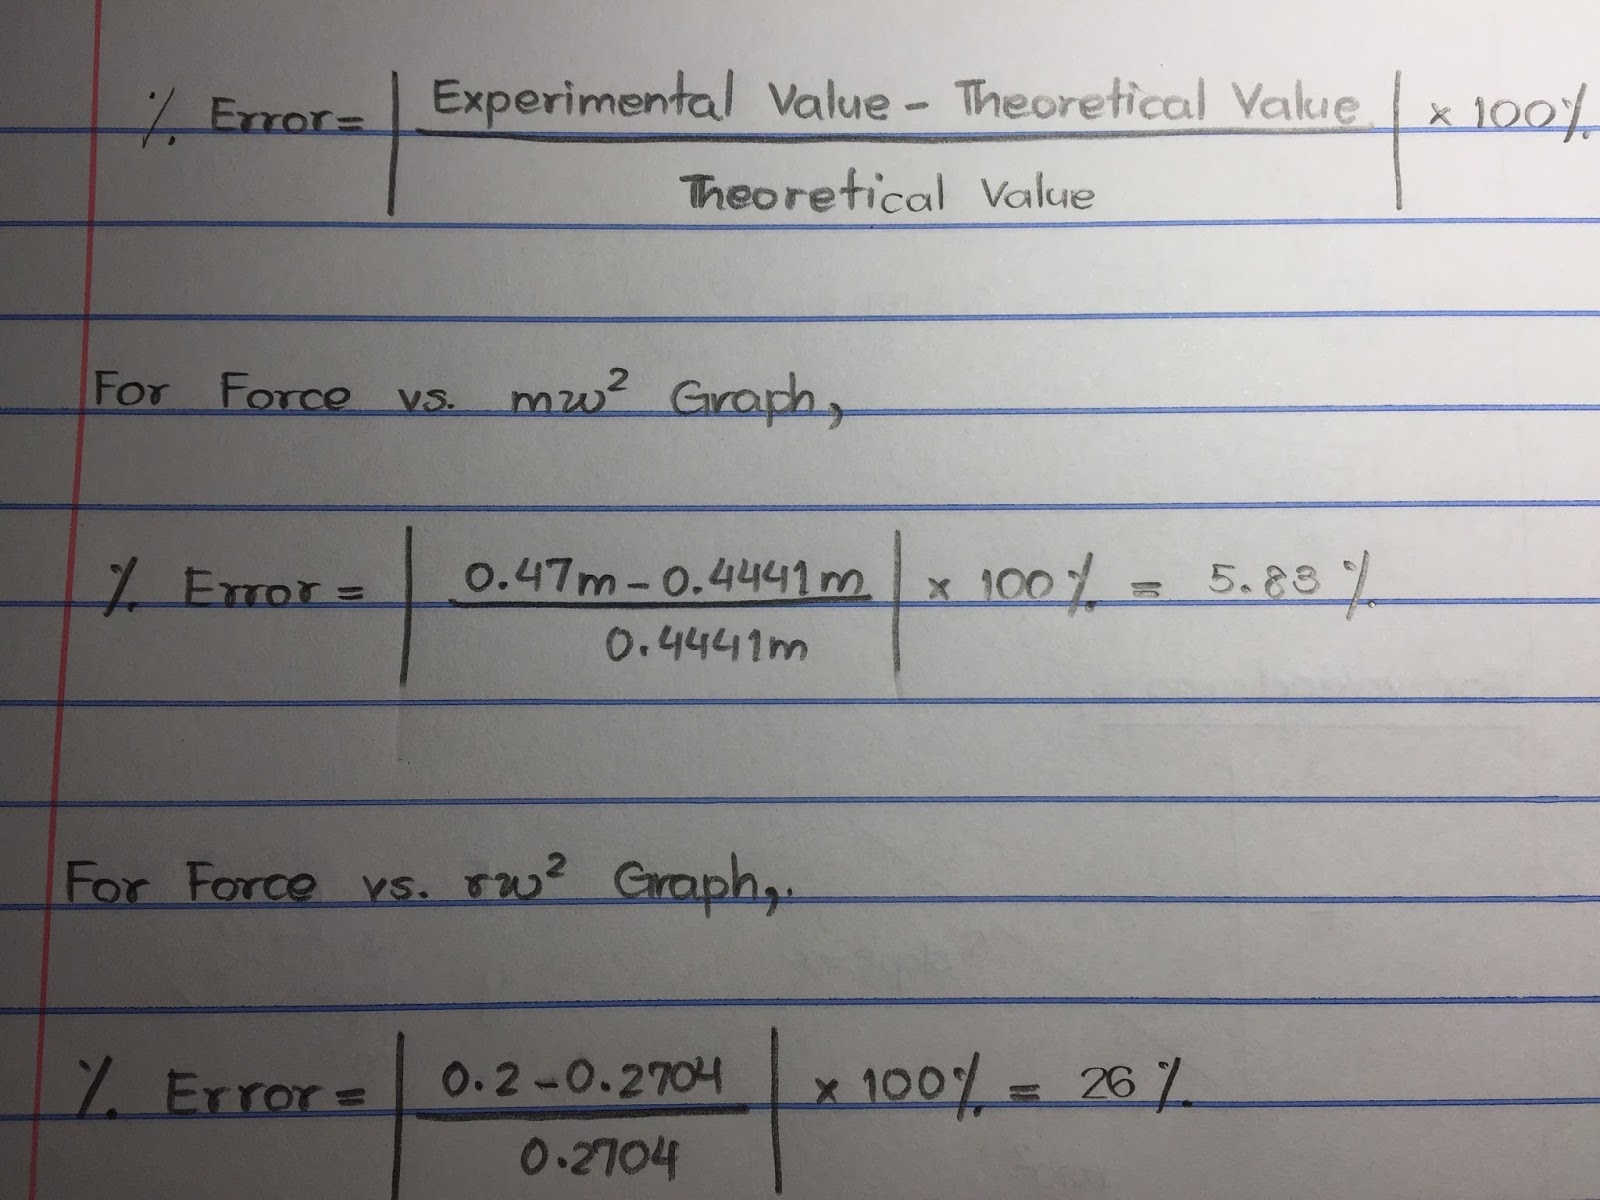
Percent Error:


For Force vs. mω2 graph, the percent error came out to be 5.83%, which is in the acceptable range. But the Force vs. rω2 graph, the percent error came out to be 26%, which is not in the acceptable range. 

Conclusion: There were a lot of errors that led to this large percentage of error in this lab. The errors were such as calibration of force sensor drifted over time, not doing the root-mean-square average for ω2, and the uncertainty got larger twice as much by squaring the ω, and the experiment was not repeatable since it did not give us the same results every trial. For the first experiment with varying masses, the experimental measurement of the mass was pretty close to the theoretical value we got from the slope of the Force vs. mω2 graph-- radius r. For the second experiment with varying radii, the experimental measurement of the mass was 0.0704 larger in value and had 26% as error. 

Tuesday, April 4, 2017

22-March-2017: Modeling Friction Forces

Lab#7: Modeling Friction Forces
May Soe Moe
Lab Partners: Ben Chen, Steven Castro
22-march-2017

Objective: To produce a model that gives the coefficient of static and kinetic frictions through five different experiments

Introduction: We had learned that there are static and kinetic friction forces acting on an object if the surface is not totally smooth. Static friction is the friction force between two bodies when they are in fixed position. Kinetic friction is the friction force between two bodies when they move and slide against each other. We also have equations for both friction forces, which are f(static maximum)= μs*N, and f(kinetic)=μk*N. μs indicates the coefficient of static friction whereas μk indicates the coefficient of kinetic friction, and N indicates the normal force of an object. We used these equations and set up scenarios where we could figure out the coefficients of static and kinetic frictions by manipulating these equations, calculating them mathematically, or by figuring out through the graphs.

Experimental Procedures:

Experiment 1: Static Friction


(1) Set up the lab as above. We used a white board and a block with linoleum tile attached to its bottom due to their smooth surface. We also connected the block with a pulley to have another block hanging vertically as in the picture. Through this experiment, we will find out the tension, which was also the maximum static friction force. How we figured out the tension or the maximum static friction force was by adding masses to the hanging mass until the block on the white board started to move. We taped the initial position of the block--using blue tape on the white board--to let us know if the block has moved or not. When the block started to move, we removed the latest mass that made the block move and recorded the hanging mass. The mass that made the block move was 70 g.

(2) We kept repeating the same procedure by putting 200 g on top of the block during second scenario, 400 g in third scenario, 600 g in fourth scenario and 800 g in fifth scenario, and kept adding the masses to the hanging mass until the block started to move. We recorded them and the masses came out to be as below:

In this graph, the y-axis represents the static friction of the hanging mass; the x-axis represents the weight of the block or Normal force; and the slope represents the coefficient of static friction or mg.
Therefore, from this graph, the coefficient of static friction is 0.4125.

Experiment 2: Kinetic Friction

(1) We figured out the coefficient of the kinetic friction through this experiment. 
(2) Frist, we tied and connected a block and a force sensor with a string, connected to the computer with LabPro. We calibrated the force sensor using 500 gram hanging mass so that we could get reliable data. 
(3) After the calibration, we slowly pulled the board instead of a block at a constant speed and collected data with LabPro. We averaged the force exerted on the board using Statistics from Analyze menu and recorded the average value. Constant speed in this case made the net force equaled to zero. From the graph, we got the coefficient of kinetic friction to be 0.5197, which is the y-intercept of the graph. 


Experiment 3: Static Friction from a Sloped Surface

(1) We placed a block horizontally on the white board and raised one end of the board, tilting it until it started to slide down. The angle when the block started sliding down was 24Degree, and we used this angle to determine the coefficient of static friction between the block and the surface. 


Experiment 4: Kinetic Friction From Sliding A Block Down An Incline

(1) Putting a motion detector at the top of an incline which made the block accelerate down the incline. We measured the angle of the incline that made the block slide down and recorded the acceleration of the block using the LoggerPro and motion detector.


 (2) From the graph, acceleration of the block is the slope of the velocity versus time graph, which is 1.912m/s^2. Through calculation using Newton's Second Law and equation of kinetic friction, the coefficient of kinetic friction came out to be 0.312.


Experiment 5: Predicting the Acceleration Of a Two-Mass System

(1) Using the coefficient of kinetic friction I got from experiment 4,we derived an expression for what the acceleration of the block would be if we used a hanging mass sufficiently heavy to accelerate the system. 


Comparing our acceleration from velocity versus time graph and acceleration from derivation and experiment, our mathematical acceleration was off by 0.568. 

Conclusion: This experiment had a lot of uncertainties and many rooms for errors. This experiment cannot be done repeatably because you will not get the same results from different trials.