May Soe Moe
Lab Partners: Ben Chen, Steven Castro
27-March-2017
Objective: To determine the relationship between centripetal acceleration and angular frequency
Introduction: To achieve our objective, we made measurements that will help calculate the values such as ω(omega) and frequency to help find the relationship, which are: (1) the time it took for the disk to make ten rotations at a range of power supply, (2) force during rotation, and (3) distance of the mass from the center of the rotating mass. Through these datas we got from measurements, we would plot Force vs mω^2, and Force vs rω^2. The slope of these graphs would be radius and mass of the object respectively.
Experimental Procedure:
This whole experiment was done by the professor and the datas we took were used by all classmates due to the limited quantity of apparatus and the time restraint.
 |
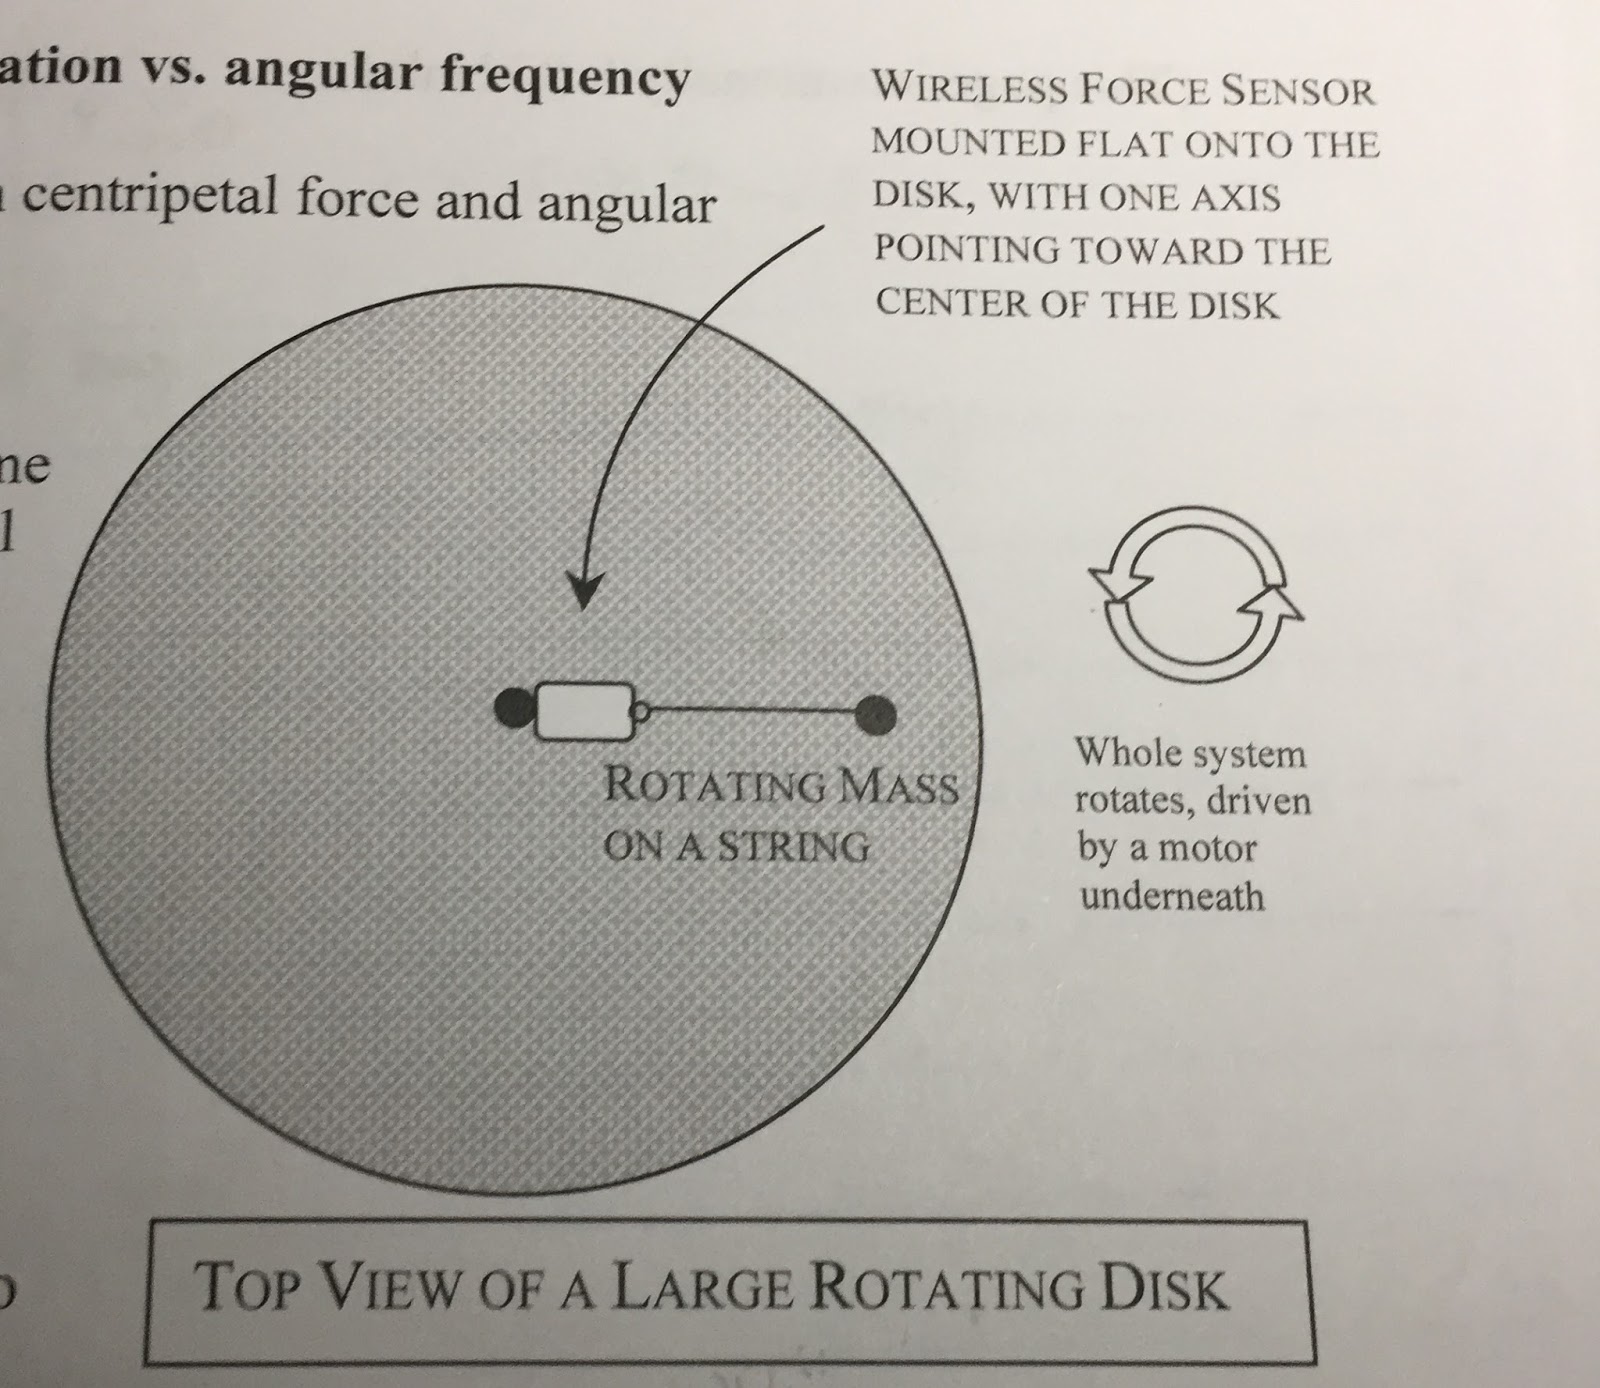
| Our Apparatus of the Day: Rotating Disk |
 |
| Side View of a Large Rotating Disk with set up of Photogate |
(1) Placed the wireless force sensor on the disk and let the force to be zero at the beginning of the disk rotation. Used a piece of tape on the disk rim to make sure it passes through the photogate when the disk was rotating. Photogate helped determine the rotational speed of the disk.
(2) Adjusted the voltage on the power supply, turned on the scooter motor, let the disk rotate at a constant speed, and recorded the force sensor reading.
(3) Collected period and force data at varied rotational masses (0.3kg, 0.2kg, 0.1kg, and 0.05kg) at a fixed speed, at varied radii (0.548m, 0.39m, 0.23m, and 0.47m) at fixed mass and speed, and at varied voltage from the power supply feeding the motor (3.4, 3.8, 4.2, and 3), which was various rotational speed at constant mass and constant radii.
 |
| Getting Data from Force Sensor |
 |
| Getting Data for Time at specific rotation The peak of each section of the graph represents the time after numbers of rotation. |
 |
| Data of Varied Rotational Mass, Constant Speed, Constant Radii, and Other Calculations |
 |
| Data of Varied Radii, Constant Speed, Constant Mass, and Other Calculations |
 |
| Data of Varied Speed, Constant Mass, Constant Radii, and Other Calculations |
(5) Our formula for this lab to figure out the relationship between the centripetal acceleration and angular frequency was

(6) Our first attempt to plot was a failure because one of the linear fit of the graph was not constant or as near to constant when we plotted the datas we got. If we had been successful in our first attempt, the graphs should look like this:

(7) Since our first attempt was a failure, our next attempt was by plotting in different way as shown in the picture below:

 |
| Force vs. mω2 Graph, Slope= radius= 0.4441 |
 |
| Force vs. rω2 Graph, Slope =mass= 0.2704
Comparisons of Actual Measurements and Graphically Calculations:

Percent Error:
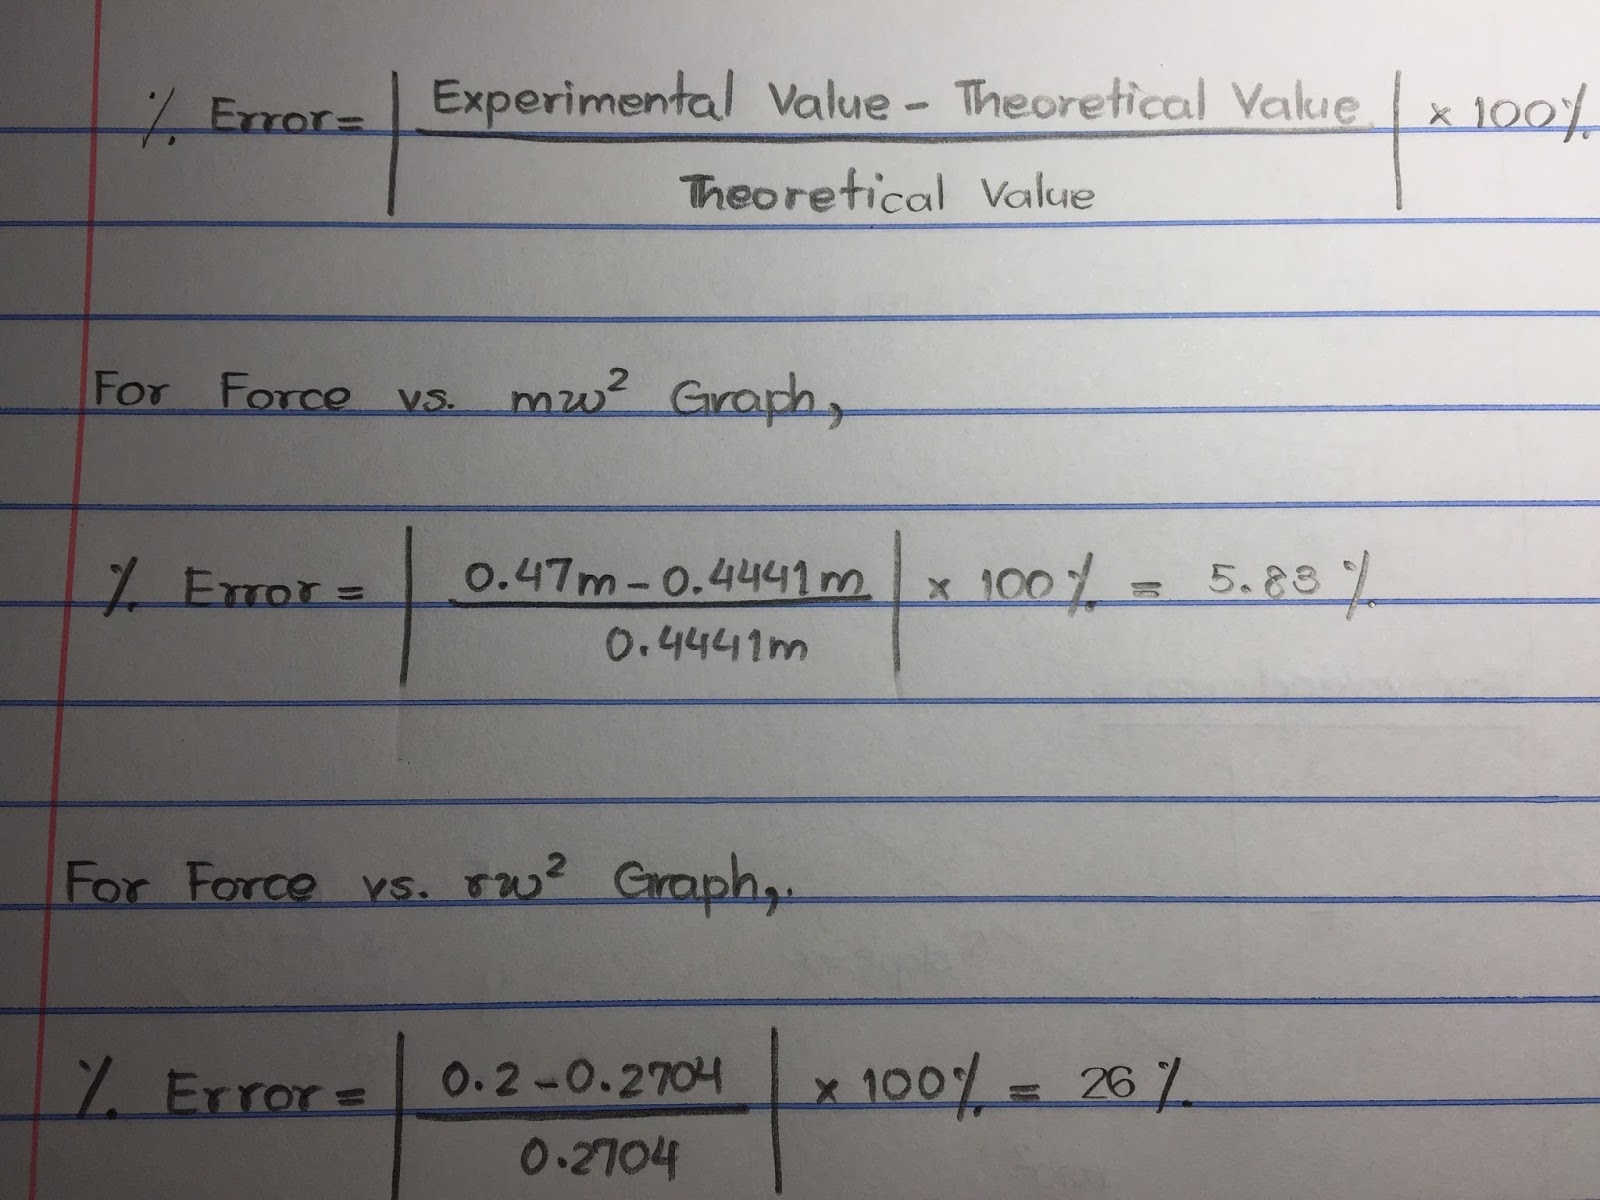
For Force vs. mω2 graph, the percent error came out to be 5.83%, which is in the acceptable range. But the Force vs. rω2 graph, the percent error came out to be 26%, which is not in the acceptable range.
Conclusion: There were a lot of errors that led to this large percentage of error in this lab. The errors were such as calibration of force sensor drifted over time, not doing the root-mean-square average for ω2, and the uncertainty got larger twice as much by squaring the ω, and the experiment was not repeatable since it did not give us the same results every trial. For the first experiment with varying masses, the experimental measurement of the mass was pretty close to the theoretical value we got from the slope of the Force vs. mω2 graph-- radius r. For the second experiment with varying radii, the experimental measurement of the mass was 0.0704 larger in value and had 26% as error.
|
No comments:
Post a Comment