Monday, May 29, 2017

22-May-2017- Lab 17: Finding the Moment of Inertia of a Uniform Triangle about its Center of Mass

Lab 17: Finding the Moment of Inertia of a Uniform Triangle about its Center of Mass
May Soe Moe
Lab partners: Ben Chen, Stephanie Flores, Steven Castro
Date: 22-May-2017

Objective: To determine the moment of inertia of a uniform triangle about its center of mass through experiment and compare the experimental and theoretical values

Introduction:
To determine the moment of inertia of a uniform triangle, we will orient the triangle into two perpendicular orientations in this lab. We will determine they moment of inertia based on its orientation. The triangle will be mounted on the apparatus, which will rotate by using air source. A string is going to be wrapped around a torque pulley to a hanging mass, which will exert torque. We will measure the angular acceleration of the rotating disk using Logger Pro, by graphing an angular velocity vs. time graph. We will get the slope of the graph by using linear fit, in which the slope will be our angular acceleration. For experimental approach, we will use our derived equation for the moment of inertia. For theoretical approach, we will use the parallel axis theorem to get our moment of inertia equation. Once we have our equations ready, we will plug in the measurements such as mass of the hanging mass, radius of the torque pulley, average angular acceleration, mass of the rotating disk, and so on, to calculate the moment of inertia of the triangle around its center of mass. Then, we will compare the results.

Experimental Procedure:

(1) Our apparatus is as below:


(2) We set up our triangle into two different orientations as in the pictures above.

(3) We connected the rotational sensor and Lab Pro to our laptop and used Logger Pro to record the angular acceleration of the rotating disk.

(4) We measured the height of the triangle, the base of the triangle, the masses of the rotating disks and torque pulley, their diameters, the mass of the hanging mass, the mass of the holder that holds the disk and triangle together.

(5) We ran the experiment two times orienting the triangle differently.

(6) Using logger pro, while the disk along with the triangle was rotating, we graphed the angular velocity vs time graph.

(7) We used linear fit to figure out the slope of our graph, in which the slope is our angular acceleration. We found our ascending angular acceleration and descending acceleration, which were not the same due to the presence of the frictional torque in the system.

Experimental Data and Calculations:


Measured Data

Experimental Calculations for Moment of Inertia of an Uniform Triangle in Two Different Orientations
Experimental Calculations For Moment of Inertia of an Uniform Triangle in Two Different Orientations

Theoretical Calculations:

Calculating x-Center of Mass of triangle to find Moment of Inertia

Finding the Moment of Inertia of the triangle rotating around its edge

Moment of Inertia of the triangle around its center of mass
Theoretical Calculations for the Moment of Inertia of a Triangle in Two Different Orientations
Comparing Results- Theoretical Vs. Experimental:

Comparing experimental results vs. theoretical results
Conclusion:
When comparing our theoretical and experimental calculated results of the moment of inertia of the triangle in two different orientations, there is a difference of 11.8% and 11.2%. Percent errors are within 11%, which should still be in acceptable range as long as it is under 15% percent error. Therefore, the lab was successful. 

17-May-2017, 22-May-2017: Lab 18: Moment of Inertia and Frictional Torque

Lab 18: Moment of Inertia and Frictional Torque
May Soe Moe
Lab Partners: Ben Chen, Steven Castro, Stephanie Flores
Dates: 17-May-2017, 22-May-2017

Objective: To determine the moment of the inertia of the system, to determine the angular deceleration, to determine the frictional torque, and to determine the time it takes to descend for a cart to get to one meter mark of the ramp

Introduction:
Our apparatus consists of a disk and two cylinders, which are all attached together. We will consider the system to be consisted of three cylinders. The moment of inertia of the system is the sum of the moment of inertia of three cylinders. Since we do not know the mass of the two cylinders from the sides, we will calculate the volume of the cylinders after measuring their radius and height, and the total mass of the whole system. After calculating the volume of the system and each of the cylinders, we will calculate the mass of each cylinder. Once we ind out the mass of the cylinders, we will find out the moment of inertia of each cylinder by using I=1/2MR^2. For part 2 of the lab, to figure out the angular deceleration, we will take a slow-motion video of the system rotating. We will use logger pro and to dot around the rim of the disk rotating, which will give us the angular velocity vs. time graph. We will find the angular deceleration by finding the slope of the angular velocity vs. time graph. Then we can find torque by using T=Iα. For part 3 of the lab, we will wrap a string around the middle disk and connect it with a 500-gram dynamics cart. Using the Newton's Second law to get a representative expression for acceleration of the cart. After that we will use the kinematics equation to figure out the time it takes to reach 1 meter mark of the ramp.

Experimental Procedure:

Part 1:
(1) Our apparatus looks as below:

Front view of the apparatus

The apparatus consists of one big disk, and two cylinders on the sides as in the picture.

(2) We took measurements of the diameters of the cylinders, the height of the cylinders. The total mass of the cylinders are stamped onto the big rotating disk.

Part 1 Data and Calculations:
Measured data of the system
Volume Calculation of the three cylinders to figure out the mass of each cylinders
Calculation of Mass of each Cylinder to find the moment of inertia of the system
Calculation of the Moment of Inertia of the System Consisting two cylinders and a disk
 Experimental Procedure:

Part 2:

(1) We put the ring stand in front of the apparatus and set up an iPhone to the ring stand.

(2) We align the iPhone's camera to the center of the system.

(3) We took slow-motion video of the disk rotating around its center. We made sure it was 240 frames per second.

(4) We opened our slow-motion video in Logger Pro and dot around the rim of the disk. The dots around the rim would produce the angular velocity vs. time graph.

(5) We used linear fit to find the angular deceleration, which is the slope of the angular velocity vs. time graph.

Part 2 Data:

The dots around the rim of the disk and how the dots produce graph 

The angular acceleration of the rotating disk around its center, which is -0.4395 rad/s^2-- slope of the graph.
 When we did the dots around the rim of the disk, each dot was 30 frames per second, which is 8 times faster than the actual time, since we shot the video at 240 frames per second. Therefore, in the picture and graph above, our x-axis is actual time, and we divided the time we got for 30 frames per second by 8. Our angular deceleration for the disk came out to be -0.4395 rad/s^2, according to the graph.

Now we can calculate the frictional torque.

Part 2 Calculation:

Frictional Torque Calculation using the Angular Deceleration we got from the graph
The result from calculating frictional torque using the calculated moment of inertia from part 1 and the angular acceleration from part 2 came out to be -9.348x10^-3 kgm^2/s^2.

Experimental Procedure:

Part 3:

(1) We did the set up as below:
Our apparatus set up for part 3of this lab

The ramp is 50 Degree above horizontal
(2) After the set up, we measured the horizontal angle using the level from iPhone, which came out to be at 50 degree.

(3) After that we wrapped a string around the large disk, connecting to the cart.

(4) We started the rotation, and timed the time it took for a cart to reach 1 meter mark.

(5) We did this process three times. Our average time for the cart to reach 1 meter mark was 6.76 seconds.

Part 3 Calculation:
Calculation for time it took for the cart to reach 1 meter mark
The calculated time based on our previous calculated results such as the frictional torque and moment of inertia of the system, came out to be 6.16 seconds, while the average timed time of the cart to reach 1 meter mark was 6.76 seconds. There is a 0.6 seconds difference. Therefore, I calculated the percentage error for our result.

Percentage error for the difference between experimental time and theoretical time
The percent error for the time difference was 9.74%.

Conclusion:
For part 3 of the lab, where we compare the experimental time--the average time we got by using the timer for the cart to reach one meter mark-- and the theoretical time--the time we calculated by using the previous calculations from part 1 and 2 of the lab, which are the moment of inertia of a system and the frictional torque, we found that there was 0.6 seconds difference between the two. I calculated the percent error and it was 9.74%, which is less than 10% and we could say this is within acceptable range. Errors could be because the ramp moved every time the cart reached to the bottom, near 1 meter mark. Although we used several masses at the end of the ramp to make sure it stays still, it didn't work and we might not have readjust the angle to 50 degree as in the beginning after each trial. There could be some friction on the ramp that we did not consider in this lab and in our calculations. The measurement of the angle was done with the phone app, which might have some uncertainties in its measurements. Overall, the lab was successful that the error was within 9.74%.


Monday, May 22, 2017

8-May-2017, 15-May-2017- Lab 16: Angular Acceleration


Lab 16: Angular Acceleration
May Soe Moe
Lab Partners: Ben Chen, Steven Castro, Stephanie Flores
Dates: 8-May 2015, 15-May 2015

Objective: To measure the angular acceleration of the rotating object by using torque and to determine the moment of inertia of the rotating disks used in this lab

Introduction:
In this lab, we will collect data in part 1 and figure out the angular acceleration of the rotating disk. In part 2, using the part 1 data, we will determine the moment of inertia.We are using two disks that will rotate and two different torque pulley on top that will hang a hanging mass with a string. For the first part to figure out the angular acceleration, we will apply various changes to the experiment. By applying these changes in six experiments, we can figure out how these changes affect the angular acceleration. In the first three experiments, we intend to observe the effect of changing the hanging mass. In the first and fourth experiment, we use two different hanging pulley with same mass. In the last three experiments, we will observe the effect of changing the rotating mass (steel disk to aluminum disk). We will use logger pro to record the angular acceleration during the disk rotation. For part two of the experiment, we will use the angular accelerations we got from the part 1 of the lab to plug into the moment of inertia equations for the disks that we derived in class.

Experimental Procedure:

Part 1:

(1) Our apparatus is as in the picture below:
Apparatus to measure angular acceleration
(2) We measured the masses and diameters of the rotating disks and torque pulleys.

(3) We used compressed air to let the disks rotate. As the disks rotate, the hanging mass that is wrapped around the torque pulley moves up and down.

(4) We connected the Pasco rotational sensor and Lab Pro to Logger Pro on a laptop to help us record the angular acceleration of the rotating disk as it is rotating and as the hanging mass goes up and down.

(5) After setting up, we did six experiments by changing the hanging mass, by changing the torque pulley with different radii, by changing the rotating disk between steel disk and aluminum disk.

(6) During this six experiments, we recorded the angular velocities of the rotating mass.

(7) We used linear fit to find the slope of the angular velocities and found the slope to be its angular acceleration. When the hanging mass goes up, the angular acceleration of the disk on the graph goes down. When the hanging mass goes down, the angular acceleration of the disk on the graph goes up.

Part 1 Data: 


Measurements of the rotating disks and torque pulleys
Hanging mass used and angular accelerations from our graphs during six experiments
Angular Acceleration of the Rotating Disk (slope m) from the Angular Velocity Vs. Time Graph [Experiment 1]

Experiment 2- Angular Acceleration of the Rotating Disk

Experiment 3

Experiment 4

Experiment 5

Experiment 6
Conclusion For Part 1: 
From our data, we found that the average angular acceleration of the experiment 2 and the experiment 4 are similar. We doubled the hanging mass for the experiment 2 and used the large torque pulley which has twice of larger radius than the small pulley. Increasing the hanging mass increases the angular acceleration of the rotating disk. In experiment 6, when both the top and bottom steel disks rotated, the angular acceleration slowed down by half than just the top steel disk rotating. When the rotating disk has smaller disk, in this case Aluminum disk, and the torque pulley with twice radius, the average angular acceleration of the disk got around three times faster.

Part 2:

Procedure:
The professor showed us how to derive the moment of inertia equation, involving the hanging mass and torque pulley in class. The expression we derived for the moment of inertia of the rotating disk is as below:

Derived Moment of Inertia of the rotating disk Equation
There is some frictional torque in the system since the rotating disk is not totally frictionless and we cannot neglect the mass of the pulley. We can confirm this by checking our angular acceleration values. We see that the ascending angular acceleration were not the same as the descending angular acceleration. Therefore, we used the first equation of the moment of inertia from the picture. The second equation is for when there is no friction involved in the system.

Part 2 Calculation: 
Calculation of Moment of Inertia of different disks in six experiments 
Conclusion:
When we looked at our experimental results of the moment of inertia of rotating disks, the first four experiments should have approximately the same results due to using the same torque pulley and the rotating steel disk. But the calculated moment of inertia of the disk for the first experiment was off by half of the moment of inertia of the disks of the second, third, and fourth experiments. The calculated moment of inertia of the second, third, and fourth experiment came out to be pretty close and consistent. The fifth and sixth experiment's moment of inertia of the disks also seemed reasonable. 

Wednesday, May 10, 2017

26-April-2017, 3-May-2017: Ballistic Pendulum

Lab: Ballistic Pendulum
May Soe Moe
Lab Partners: Day 1: Steven Castro, Stephanie Flores, Henry Wang, Tomas Pacual, Garrett Giordano, Jesus Gonzalez, Ben Chen
Day 2: Steven Castro, Stephanie Flores, Henry Wang, Ben Chen
Date: 26-April-2017, 3-May-2017

Objective: To determine the firing speed of a ball from a spring-loaded gun and to determine how far the ball lands after it is launched horizontally

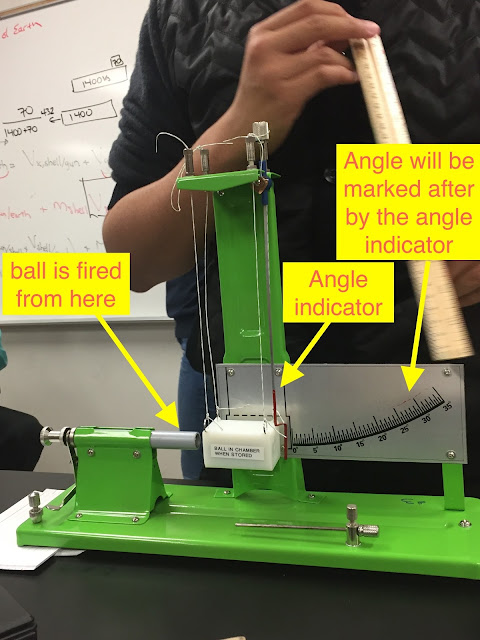
Introduction: There are two parts for this lab, which we performed on two separate days. For the first part, using a spring-loaded gun, we will fire a ball into a nylon block, supported with four vertical springs. The ball will be stuck into the block, and the block, together with the ball, will rise up to some angle, which we will measure with the angle indicator on the apparatus. To figure out the ball's firing speed, we will use conservation of momentum (momentum p=mv) to write an expression representing the initial speed of the ball, immediately after the collision. Conservation of momentum states that momentum is conserved if there is no net external forces acting on a system of objects, and those objects will have equal and opposite force acting on each other. For the second part, we lay out the apparatus above a pile of books. We estimate where the ball would land after the launch horizontally, and test it out. We put the carbon paper on the floor approximately at the point where it would land to mark out its final position. We will take appropriate measurements such as the height of the spring loaded gun from the ground, and the distance of the final position of the ball from the apparatus. We will use conservation of energy to get the initial firing speed of the ball and compare the two velocities we got from part 1 and part 2 of this lab.

Experimental Procedure:

Part 1: 
(1) Our apparatus looks like this:


(2) The ball is fired from the spring-loaded gun and it went into the nylon block, supported with four vertical strings.

(3) There is a hole inside the nylon block, so that the ball will stay inside the block after the collision.

(4) After the collision, the ball along with the block moved to some maximum vertical angle, that is indicated by an angle indicator from our apparatus.

(5) The collision also caused change in height of the block. 

(6) We repeated the process about six times to get an average angle. 


Part 1 Calculations:


Firing speed of the ball resulted as 4.9m/s.
(7) Our calculations give us the firing speed of the ball to be 4.9 m/s.

Part 2: 
Experimental Procedure:

(1) We set up our apparatus as below:

Our set up for Part 2 of the Ballistic Pendulum lab
(2) The height of the pile of the books to the spring loaded gun was measured as 20.5 cm (0.205m). 

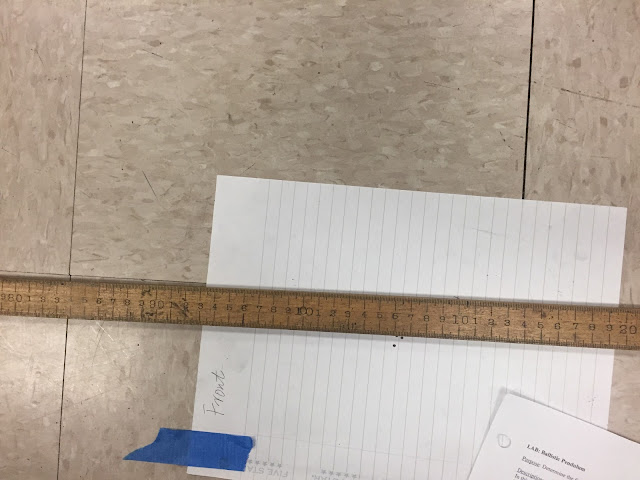
(3) We estimated where the ball would land after firing it and put a blank sheet of white paper and carbon paper on top. We repeated this process for four times. 

(4) After that we removed the carbon paper and measured the distance of the ball's position after it landed from the apparatus, using a meter stick. 

Measuring the distance from the apparatus to where the ball landed
Part 2 Calculations:

Firing speed of the ball came out to be 5.175 m/s
Conclusions:
             The first part's initial firing speed is 4.9 m/s and the second part's initial firing speed is 5.175 m/s. There are uncertainties in our data that caused the difference in two firing speed of the ball. Our measurements of the angles, masses of the block and the ball, the height of the apparatus, height of the book pile, and the distances we measured away from the apparatus to where the ball landed were not exact numbers as we calculated. We used the average of he angles and distances we got from our trials to calculate it. The other factor to consider about the difference in firing speed is that we did this lab in two separate parts and two separate days. It is possible that we used different apparatus for two parts. But the difference between two results of the firing speed from the calculation was not large. 

Monday, May 1, 2017

26-April-2017: Lab 15-Collisions in Two Dimensions


Lab 15: Collisions in Two Dimensions
May Soe Moe
Lab Partners: Ben Chen, Steven Castro
26-April-2017

Objective: To determine if momentum and energy are conserved by looking at a two-dimensional collision

Introduction: The conservation of energy states that the total energy before the collision is equal to the total energy after the collision, which stays at a constant. The conservation of momentum states that if there is no net external force acting on objects, the momentum before the collision is equal to the momentum after the collision. We would use two steel balls to have a collision between those two balls for the first part. For the second part, we would use one steel ball and one marble and let them collide each other. For both parts, one ball is to be at rest while another ball moves toward the first ball, which is at rest, and collides. We would take two slow-motion videos of the collisions for both sets of balls. We would use the Logger Pro to trace their direction of motion and put it on a graph. We would get the velocities of the balls before and after collisions by getting the slopes from our graphs. Then we would use that velocities to calculate if the momentum and energy are conserved or not.

Our apparatus for this lab
Experimental Procedure:

(1) The glass table for this lab was already set up. We had to make sure if the table was leveled. We could check it by seeing if the ball stays at rest without rolling to the other side. If the ball stays at rest, then it is leveled.

(2) We set up the phone we would use to record the collision at the stand attached to the glass table. The stand is set up so that the phone is in the position of filming the process of collision clearly. The filming was done by using iPhone's slow motion capture feature in the phone's camera.

(3) Before we started filming the collision, we practiced rolling the steel ball toward other to make sure that the first moving steel ball hits the second ball at rest.

(4) Once we felt ready to film, we filmed the collision of two balls. We filmed two videos: One video involving the collision between one steel ball moving and one steel ball at rest, and another video involving the collision between one steel ball moving and one marble at rest.

Steel ball and Marble Collision

Steel ball and Steel ball Collision

(5) After we got the videos, we transferred the videos from our phone to the computer. We opened the video using Logger Pro and trace the direction of the balls before and after collision.

(6) Logger Pro allows us to plot the graph of the motion of the ball by transferring the tracing of the balls' directions.

(7) Once we got the graph, we did linear fit and got the equations for before and after collisions. The slope of those equations would give us the velocities of the balls. Logger Pro can also give us the positions of ball in x and y directions after they collide. So, in the graph, x and x2 are x-directions of motions for two different balls and y and y2 are the y-directions of motions.

Two Steel Balls Collision-Before the Collision Positions and Velocities
Red line for x-direction, Blue Line for y-direction of Moving Steel Ball
Green for x-direction, Brown for y-direction of Stationary Steel Ball


Two Steel Balls Collision- After the Collision Positions and Velocities
Red line for x-direction, Blue Line for y-direction of Moving Steel Ball
Green for x-direction, Brown for y-direction of Stationary Steel Ball


A Steel Ball and a Marble Collision-Before Collision Positions and Velocities
Red line for x-direction, Blue Line for y-direction of Moving Steel Ball
Green for x-direction, Brown for y-direction of Stationary Steel Ball
A Steel Ball and a Marble Collision-After Collision Positions and Velocities
Red line for x-direction, Blue Line for y-direction of Moving Steel Ball
Green for x-direction, Brown for y-direction of Stationary Steel Ball

(8) One question from our graphs was that how do we know if to certain position is before the collision or after the collision.

(9) We could figure that out by seeing their graphs. Before the collision, one ball was moving with a constant velocity, which we could see x2 moving in a constant slope. X on the graph pretty much stayed constant on a straight line, which we knew it was at rest. After the collision, you could see their slopes change, which means they moved, therefore, after the collision.

Data and Calculations for Collision between 2 Steel Balls


Checking if Kinetic Energy is Conserved in between 2 Steel Balls


Data and Calculations for Collision between a Moving Steel Ball and a Stationary Marble

Checking if Momentum and Kinetic Energy are conserved

Calculations and Analysis:
 I calculated the initial momentum, initial kinetic energy, final momentum, and final kinetic energy of the two steel balls to see if the momentum and kinetic energy were conserved. For conservation of momentum calculation, the difference between initial momentum and final momentum were 0.04325, which is about 5.8%. If we were to approximate our results, then, yes, the momentum of two steel balls are conserved. The percentage for momentum was not big. For conservation of kinetic energy, the initial kinetic energy and final kinetic energy were off by 0.0789, about 36.9%, which is way too off. For the second video, where the steel ball moves toward the stationary marble, I did the same calculations, which can be checked in the pictures above. There were also 2.18x10^-4 or 1.33% difference in initial momentum and final momentum. But this value is really small that we could say the momentum between the steel ball in motion and stationary marble are conserved. When we look at the conservation of kinetic energy calculation, we can see that the difference between initial and final kinetic energy is 8.019x10^-4 or 21.7%. Again, the differences for these can be considered small. But I noticed from our conservation of kinetic energy calculations that the percentages were high for both videos.

Conclusion: These differences in calculations might result from the glass table, which we assumed it was leveled after checking that the balls stay at rest. But the graphs that we got say something else. When I checked the graphs, the velocity of stationary balls were not exactly zero.
The other error could be that we did not click on the same point of the balls when we were doing the video analysis using Logger pro to produce our graphs. That could have affect our accuracy of the results. The other factor to think was that there was kinetic friction between the balls and the glass table when they were rolling on the table, which would turn into heat. We ignored the factor of kinetic friction in this lab. If we approximate our results, then we can say both momentum and kinetic energy are conserved.